technical analysis
-
Trading Cryptocurrency
How to trade cryptocurrency? Simply put it is the same as any asset in that the trader will want to buy low and sell at a higher price. Sounds simple enough in the world of cryptocurrencies, and where prices can go up rapidly, easily 10-20% in minutes, or 50-100% over a day or two, it should be easy to simply buy some cryptocurrency and wait a while, selling once it makes a substantial gain. But crypto can also go down rapidly by the same amounts, and stay at a lower value for a long time, so it is also extremely easy to lose money!
Trading Cryptocurrency is not for the inexperienced, or novice trader in financial markets. Nor is it for those not willing to take risks with their money and to spend the time learning how to manage trades so as to reduce that risk. It is good advice, widely found in all the literature on trading, that you should never risk more than you can afford to lose. Trading isn't gambling, but it can take a lot of time and effort to learn how to manage the risks and preserve the trading capital, and while learning it is very likely you will lose some money, and hopefully make some. Learning to trade crypto is about discipline, risk and money management, as much as predicting the next price move.
Cryptocurrency Trading Pairs
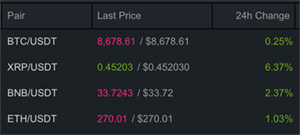
 Whenever a pair of cryptocurrencies is offered for trading on an exchange the Ticker Symbols are shown in a similar form, for Bitcoin to buy Ripple, to BTCXRP, or BTC-XRP, or BTC_XRP. The symbol to the left is called the Quote currency, which is what is used to purchase, and the price quoted of, the Base currency to the right side. So with BTC-XRP it is the price of Ripple in Bitcoin that is quoted. If the trading pair is USDT-XRP then the price is quoted and traded with USDT (Tether).
Crypto Charts
Before deciding to purchase a particular cryptocurrency it is important to understand the price as it relates to the historical data, and then to access if the current time is good to buy, or if the price is moving down and waiting a while may be advantageous. Simply buying a cryptocurrency from a consumer website, app or wallet that offers instant purchases for FIAT using a credit card may seem like an easy method, and it may be for some, but it will be difficult to assess how the price being offered relates to the actual price available direct on an exchange, or how the price reflects historical price fluctuations.
Most good places to buy crypto will incorporate a chart of the cryptocurrency historical data, available over different time frames, and up to date within the last minute. Charts are also available on dedicated websites such as TradingView (one of the most popular and widely used), Coinigy or Cryptowatch, via exchanges such as Binance, or in a range of Mobile Apps such as TabTrader.
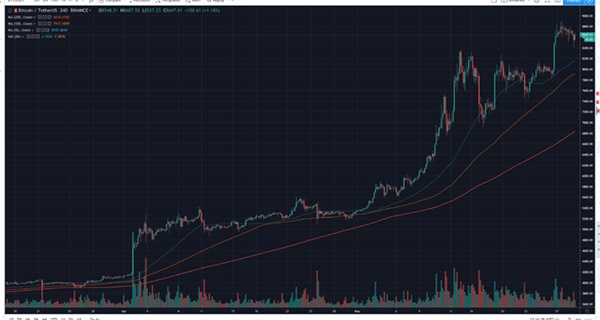
Cryptocurrency Chart - Bitcoin Transferring Cryptocurrency
Once bought the Cryptocurrency that will be used to trade with will most likely have to be transferred to an exchange for trading, such as Binance, unless it stays on the exchange on which it was bought with FIAT, such as Coinbase. With Coinbase it is possible to trade directly with FIAT, such as US Dollars (USD) or Euros (EUR), but most exchanges will only allow trading with Cryptocurrency with Bitcoin being the most used, followed by Ethereum (ETH), stable coins such as Tether (USDT) or alt coins.
It is therefore very likely that transfers of Cryptocurrency for trading will have to be made. The process should be documented fully on the exchange being used, and will include a wallet address (an example would be in the form of 3G5LytFvbAzX7QYAsRa3uGCTywYi0Z7bfv), that must be carefully copied as mistakes in sending can not be reversed! It may be advisable to send a small test transaction first to ensure that everything has been copied and configured correctly.
Technical Analysis (TA)
Technical analysis is the term used to describe the pursuit of using historical price data, shown in charts, to assess optimum entry and exit points for buying and selling Cryptocurrency (and many other assets such as stocks, shares and FOREX). It's not necessarily predicting exact price movements, but the most likely moves in price so that the trader can plan ahead depending on the actual move being made, be that a bounce off support, a break out above resistance, or a move though support down to the next support level. In this way the trader can assess potential risk to reward ratios, and wait for confirmation of the price move before buying. It is of course very much more complicated that that, and whole books and online courses are dedicated to the subject - far more than can be covered here.
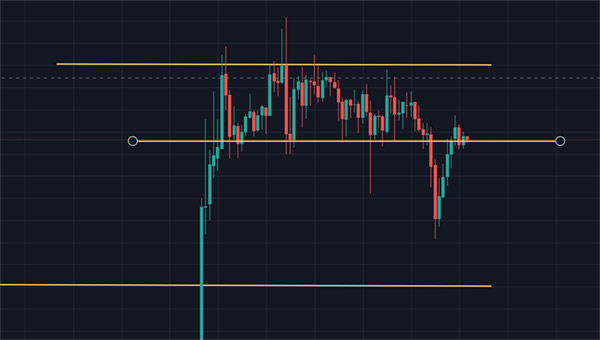
One of the most important concepts is that of resistance and support lines where the price has historically responded to a certain level by hitting it and rising above regularly, or reaching it and dropping back. These often form very noticeable patterns that can be seen on multiple time scales, from minutes to weeks, and can be useful in predicting if the price will move to a certain level then change direction, or if it breaks the level then where it might move to, and the extent of that move.